


もくじ
こんにちは。スマホアプリをメインに開発しているロッキーカナイです。
Flutterでチャートを実装したいなと思い、Dart Packagesでライブラリを探してみたところ、charts_flutterなど良いものが見つかったのですが、仕様面の問題で断念することになり、自前で作ってみることにしました。
今回はシンプルで簡易的なチャートになりますが、こんな感じで実装することができましたという紹介をしたいと思います。
これまで記事にしてきた、図形を描写するものを使ったりボーダーラインを角丸にしたりといったものを使って作ってみました。
動作環境

mac 10.14.1
Android Studio 3.2
flutterSDK 1.0.0
iOS Simulator 10.0
作成前にチャートの仕様を決める
デザイン
見た目は以下の通りにします。
- チャート枠はボーダーラインで区切る
- チャート枠は角丸にする(前回の記事【Flutter】Widgetに角丸の枠線をつける【BoxDecoration】を参照)
- 左上にタイトルを表示
- y軸に目盛り線を水平に引く
チャートの仕様
- チャートの表示はCustomPainterを用いる(【Flutter】CustomPainterで図形を表示させる【円、三角形、四角形】を参照)
- x軸は日付(String型)で3日分を表示する
- チャートに表示するy点は円を表示する
- y点数値は整数でも小数点でも表示できるようにする
難点
目盛り数値の算出が困難を極める
グラフの表示自体は難しくなかったのですが、問題は目盛り数値の算出です。
チャートy点数値データから、目盛りに表示する数値をどう算出するのか、すなわちyの最大値が89だった場合、yの線は90を表示したいですし、そもそもyが[60,70,80]というデータだとしたら、目盛りの間隔を10ずつにしたいといったような問題も出ますので、これらをどう解決するかがネックになりました。
ググった結果これらは、物理数学付録 グラフと目盛り間隔に記載がある式で求めることができました。
y点数値は整数または小数点も含まれる為、小数点データ時に目盛りの間隔に問題が生じる
y点数値に小数点のデータが含まれると目盛りの間隔が計算できない問題がありました。
これは一度小数点が含まれるデータか判断し、小数点の場合、一度整数にして算出し、目盛りの表示時に、小数点に戻す処理を行うことで解決しました。
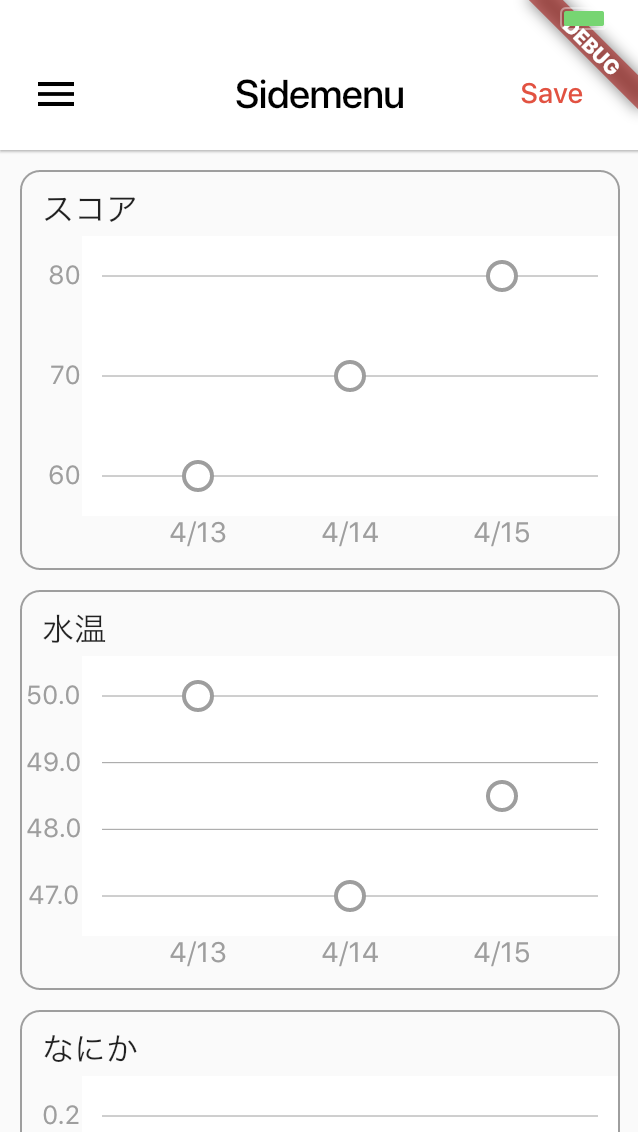
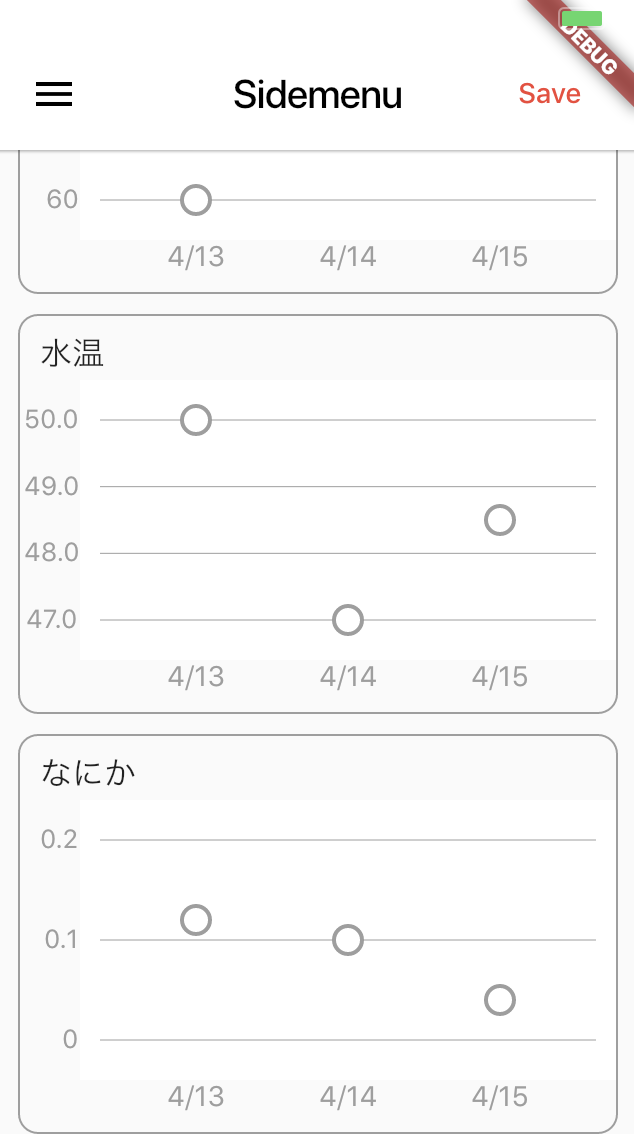
完成
完成後シュミレータ起動
コード
MyApp.dart
import 'chart.dart';

void main() => runApp(MyApp());

class MyApp extends StatelessWidget {
  // This widget is the root of your application.
  @override
  Widget build(BuildContext context) {
    return new MaterialApp(
      home: new MyHomePage(),
    );
  }
}

class MyHomePage extends StatelessWidget {
 // データ1
  final List<ChartData> _debugChartList =[
    new ChartData('4/13', 60.0),
    new ChartData('4/14', 70.0),
    new ChartData('4/15', 80.0)
  ];
  // データ2
  final List<ChartData> _debugChartList2 =[
    new ChartData('4/13', 50.0),
    new ChartData('4/14', 47.0),
    new ChartData('4/15', 48.5)
  ];
  // データ3
  final List<ChartData> _debugChartList3 =[
    new ChartData('4/13', 0.12),
    new ChartData('4/14', 0.10),
    new ChartData('4/15', 0.04)
  ];

  @override
  Widget build(BuildContext context) {
    final Size size = MediaQuery.of(context).size;

    return new Scaffold(
      appBar: new AppBar(
        title: new Text('Sidemenu', style: TextStyle(color: Colors.black),),
        backgroundColor: Colors.white,
        iconTheme: IconThemeData(
          color: Colors.black,
        ),

        elevation: 1.0,
        actions: <Widget>[
          FlatButton(
            textColor: Colors.red,
            onPressed: () {
            },
            child: Text("Save"),
            shape: CircleBorder(side: BorderSide(color: Colors.transparent)),
          ),
        ],

      ),

      drawer: Container(
        width: size.width / 5 * 4,
        child: Drawer(
          child: ListView(
            children: <Widget>[
              ListTile(
                title: Text("Item 1"),
              ),
            ],
          ),
        ),
      ),

      body: Container(
          margin: const EdgeInsets.symmetric(horizontal: 10.0),
          child: SingleChildScrollView(
              child: Column(
                  mainAxisAlignment: MainAxisAlignment.center,
                  children: <Widget>[
                    Container(
                      height: 200,
                      margin: const EdgeInsets.only(top: 10.0),
                      decoration: BoxDecoration(
                        border: new Border.all(color: Colors.grey),
                        borderRadius: BorderRadius.circular(10),
                      ),
                      child: ClipRRect(
                          borderRadius: BorderRadius.circular(8.0),
                          child: ChartContainer(_debugChartList, "スコア")
                      ),
                    ),
                    Container(
                      height: 200,
                      margin: const EdgeInsets.only(top: 10.0),
                      decoration: BoxDecoration(
                        border: new Border.all(color: Colors.grey),
                        borderRadius: BorderRadius.circular(10),
                      ),
                      child: ClipRRect(
                          borderRadius: BorderRadius.circular(8.0),
                          child: ChartContainer(_debugChartList2, "水温")
                      ),
                    ),
                    Container(
                      height: 200,
                      margin: const EdgeInsets.only(top: 10.0),
                      decoration: BoxDecoration(
                        border: new Border.all(color: Colors.grey),
                        borderRadius: BorderRadius.circular(10),
                      ),
                      child: ClipRRect(
                          borderRadius: BorderRadius.circular(8.0),
                          child: ChartContainer(_debugChartList3, "なにか")
                      ),
                    ),
                  ]

              )
          )
      ),
    );
  }
}
chart.dart
import 'package:flutter/material.dart';
import 'dart:math' as math;

// 共通チャートデータクラス
class ChartData {
  double y;
  String x;

  ChartData(this.x, this.y): super();
}

// チャートの描写をする為に位置計算などして表示するクラス
class ChartContainer extends StatelessWidget {

  // チャートの上マージン
  final double _chartTopMargin = 20.0;
  // チャートの左右マージン
  final double _chartSideMargin = 20.0;
  // チャートの高さ
  final double _chartHeight = 140.0;
  // 目盛り数値の高さ
  final double _scaleNumHeight = 20.0;
  // 目盛りに表示させる数値の配列
  List<String> _scaleNumbers;
  // チャートのデータ配列
  final List<ChartData> _charDatatList;
  // チャートのタイトル
  final _chartTitle;

  ChartContainer(this._charDatatList, this._chartTitle): super();

  // チャートのデータを生成し返す(グラフに共通地に変換)
  List<ChartData> _getChartDataList() {
    List<double> list = List<double>();

    var yMin = 0.0;
    var yMax = 0.0;
    var coarseVal = 0.0;
    var coarese = 0.0;
    var coareseDigit = 0;

    while(coarese < 1.0){

      for (var chatData in _charDatatList) {
        list.add(chatData.y * math.pow(10, (coareseDigit)));
      }
      list.sort();
      yMin = list.first;
      yMax = list.last;

      // 最大値と最小値の差
      double _differenceVal = yMax - yMin;

      // 目盛り単位数を求める(2d ≤ w)
      // http://www.eng.niigata-u.ac.jp/~nomoto/21.html
      coarseVal = _differenceVal / 2.0;
      coarese = coarseVal.round().toDouble();
      coareseDigit++;
    }

    _scaleNumbers = List<String>();
    double scaleYMax = 0;
    double scaleYMin = 0;

    var digit = 0;
    while(coarese > 10.0){
      coarese /= 10.0;
      digit++;
    }

    List<int> scaleValues = [1, 2, 5];
    bool isFinish = false;
    var count = 0;
    var multiple = 0;
    int scaleUnitVal = 0;
    while(!isFinish){
      scaleUnitVal = scaleValues[count] * math.pow(10, (digit + multiple));
      if ((scaleUnitVal * 2) > coarseVal) {
        isFinish = true;
      }

      if (count == (scaleValues.length - 1)) {
        count = 0;
        multiple++;
      } else {
        count++;
      }
    }

    // 目盛りの数値が整数値か
    var isInteger = _isIntegerInData(_charDatatList);

    // 目盛りの下限値を算出
    var lowerScaleVal = yMin - (yMin % scaleUnitVal);
    _addScaleNumberList(lowerScaleVal, isInteger, coareseDigit);


    // 目盛りの数値一覧を生成する
    var scaleVal = lowerScaleVal;
    scaleYMin = lowerScaleVal;
    while(yMax > scaleVal){
      scaleVal += scaleUnitVal;
      scaleYMax = scaleVal;
      _addScaleNumberList(scaleVal, isInteger, coareseDigit);
    }
    _scaleNumbers = _scaleNumbers.reversed.toList();


    // 一座標の数値を算出
    double _unitPoint = 100.0 / (scaleYMax - scaleYMin);

    List<ChartData> _chartList = List<ChartData>();
    for (var chatData in _charDatatList) {
      double _newY= (100.0 - (((chatData.y * math.pow(10, (coareseDigit - 1))) - scaleYMin) * _unitPoint)) / 100.0;
      _chartList.add(new ChartData(chatData.x, _newY));
    }
    return _chartList;
  }

  // 目盛り数リストに追加
  void _addScaleNumberList(double num, bool isInteger, int pow) {

    if (num == 0){
      _scaleNumbers.add('0');
    } else {

      if (pow > 1){
        var n = num / math.pow(10, (pow - 1));
        _scaleNumbers.add(n.toString());
        return;
      }

      if (isInteger) {
        int _num = num.toInt();
        _scaleNumbers.add(_num.toString());
      } else {
        _scaleNumbers.add(num.toString());
      }
    }
  }


  // データ内の数値はすべて整数か判断
  bool _isIntegerInData(List<ChartData> list) {
    for (var data in list) {
      if (!_isInteger(data.y)) {
        return false;
      }
    }
    return true;
  }

  // 整数値か判断
  bool _isInteger(double x) {
    return (x.round() == x);
  }


  // 日付のレイアウトを生成し返す
  Widget _getDateLayout(List<ChartData> list) {
    // レイアウト配列
    List<Widget> _dateLayoutList = List<Widget>();

    for (var chartData in list) {
      Widget widget = (Expanded(child: Container(
        child: Text(
          chartData.x,
          style: TextStyle(
              color: Colors.grey
          ),
        ),
        alignment: Alignment.topCenter,
      ),));
      _dateLayoutList.add(widget);
    }
    return Row(children:_dateLayoutList);
  }

  // 数値のレイアウトを生成し返す
  Widget _getChartNumberLayout() {
    // レイアウト配列
    List<Widget> barLayoutList = List<Widget>();
    var _horizontalBarNum = _scaleNumbers.length;

    // グラフ目盛り数値のマージン計算
    var marginHeight = (_chartHeight - _chartTopMargin * 2) / (_horizontalBarNum - 1) - _scaleNumHeight;

    for (var i = 0; i < _horizontalBarNum; i++) {
      Widget widget = (Container(
        child: Text(_scaleNumbers[i],
            style: TextStyle(
                fontSize: 13.0,
                color: Colors.grey
            )
        ),
        height: _scaleNumHeight,
        alignment: Alignment.centerRight,
        margin: EdgeInsets.only(top: (i == 0 ? 0 : marginHeight)),
      )
      );
      barLayoutList.add(widget);
    }

    return Column(
      mainAxisAlignment: MainAxisAlignment.start,
      children: barLayoutList,
    );
  }

  @override
  Widget build(BuildContext context) {
    List<ChartData> _chartDataList = _getChartDataList();

    return Column(
        mainAxisAlignment: MainAxisAlignment.center,
        children: <Widget>[
          Container(
            alignment: Alignment.topCenter,
            height: 32,
            child: Container(
              margin: const EdgeInsets.only(left: 10.0, right: 0, top: 5.0, bottom: 0),
              alignment: Alignment.centerLeft,
              child: Text(
                _chartTitle,
                style: TextStyle(fontSize: 16.0),
              ),
            ),
          ),

          Expanded(child:Row(children: <Widget>[
            Container(
              alignment: Alignment.topCenter,
              width: 30,
              child: Container(
                margin: const EdgeInsets.only(top: 10.0),
                child: _getChartNumberLayout(),
              ),
            ),
            Expanded(child: Column(
              mainAxisAlignment: MainAxisAlignment.center,
              children: <Widget>[
                CustomPaint(
                  painter: ChartPainter(_scaleNumbers.length, _chartTopMargin, _chartDataList, _chartSideMargin),
                  child: Container(
                      height: _chartHeight
                  ),
                ),
                Expanded(child: Container(
                    margin: EdgeInsets.symmetric(horizontal: _chartSideMargin),
                    child: _getDateLayout(_chartDataList)
                ),),

              ],
            ),
            ),
          ],
          )),
        ]
    );
  }
}


// チャートグラフ
class ChartPainter extends CustomPainter {
  final _circleSize = 7.0;
  var _horizontalBarNum;
  var _horizontalAdjustHeight = 10.0;
  var _varticalAdjustWidth = 20.0;
  List<ChartData> _chartList = List<ChartData>();

  ChartPainter(this._horizontalBarNum, this._horizontalAdjustHeight, this._chartList, this._varticalAdjustWidth): super();

  @override
  void paint(Canvas canvas, Size size) {
    final paint = Paint();
    paint.color = Colors.white;
    var rect = Rect.fromLTWH(0, 0, size.width, size.height);
    canvas.drawRect(rect, paint);


    // 横線
    paint.color = Colors.grey;
    var horizontalHeight = (size.height - _horizontalAdjustHeight * 2) / (_horizontalBarNum - 1);
    for (var i = 0; i < _horizontalBarNum; i++) {
      var y = horizontalHeight * i + _horizontalAdjustHeight;
      canvas.drawLine(Offset(10, y), Offset(size.width - 10, y), paint);
    }

    // ポイントの描写
    for (var i = 0; i < _chartList.length; i++) {
      _createPoint(canvas, size, paint, _chartList[i].y, i);
    }
  }


  void _createPoint(Canvas canvas, Size size, Paint paint, double y, int count) {

    double pointY = _horizontalAdjustHeight + ((size.height - _horizontalAdjustHeight * 2) * y);
    double scopeWidth = size.width - (_varticalAdjustWidth * 2);
    double pointX = (scopeWidth / (_chartList.length * 2) * (count + 1)) + (scopeWidth / (_chartList.length * 2) * count) + _varticalAdjustWidth;

    // 円背景
    paint.color = Colors.white;
    canvas.drawCircle(Offset(pointX, pointY), _circleSize, paint);

    // 円線
    Paint line = new Paint()
      ..color = Colors.grey
      ..strokeCap = StrokeCap.round
      ..style = PaintingStyle.stroke
      ..strokeWidth = 2;
    canvas.drawCircle(
        Offset(pointX, pointY),
        _circleSize,
        line
    );
  }

  @override
  bool shouldRepaint(CustomPainter oldDelegate) => false;
}
さいご
目盛りの算出方法など、こちら(物理数学付録 グラフと目盛り間隔)の式がなかったら、実装できておりませんでした。感謝!
flutterを真剣に触ってまだ一週間とかで、書き方が違うなどあるかもしれませんが、面白さを感じてます。
まだ、flutterの日本語の記事など少ないので、積極的にやっていきたいと思います。